Greyhound Betting Record Keeping: How to Track Bets, ROI and Edge
Best Greyhound Betting Sites – Bet on Greyhounds in 2026
Without Records, You Cannot Know If Your Greyhound Strategy Works
I met a bettor at Crayford who told me he had been profitable on greyhounds for two years. I asked to see his records. He did not have any. He “just knew” he was up. Three months later, after I convinced him to start tracking, he discovered he was down 14% on turnover. His memory had selectively retained the big winners and quietly discarded the steady trickle of losers. Without records, his confidence was built on fiction.
This is not unusual. Most greyhound bettors do not track their results systematically. Favourites winning about 33% of graded races means that winners arrive frequently enough to create a subjective feeling of success, even when the arithmetic tells a different story. The only cure for this cognitive bias is data — honest, comprehensive, unglamorous data recorded after every single bet.
Record keeping is not a chore you add to your betting routine. It is the foundation that makes every other element of your approach — selection, staking, specialisation — evaluable. Without it, you are guessing about whether you are improving, and guessing is what the rest of this site exists to eliminate.
See also: how to win greyhound betting — greyhound betting made simple.
Essential Fields: What Every Greyhound Bet Record Needs
A useful betting record contains more than just “won” or “lost.” It captures the context around each bet, enabling analysis that reveals patterns invisible in a simple profit-and-loss total.
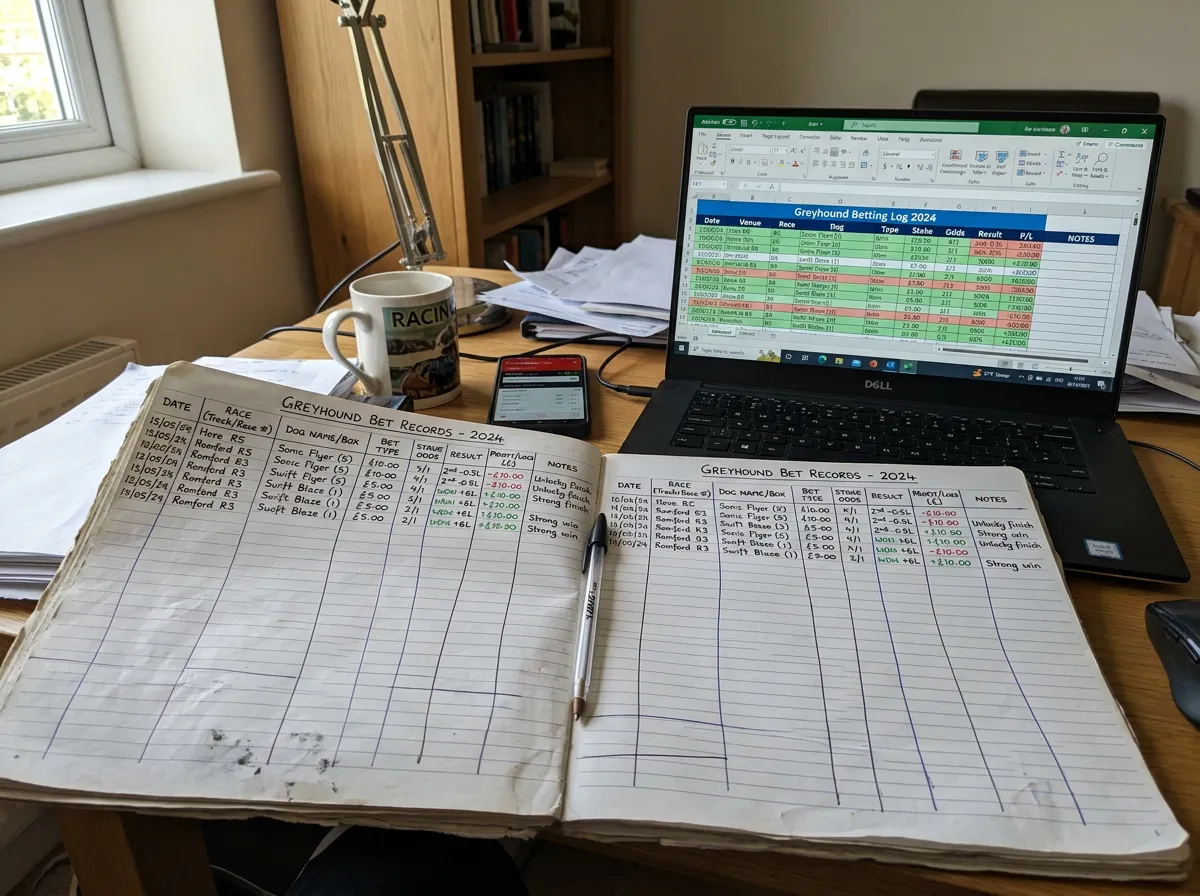
The minimum fields I record for every greyhound bet are: date, track, race time, dog name, trap number, grade, dog weight, recent form line, odds taken, bookmaker or exchange used, bet type (win, each-way, forecast), stake, finishing position, and profit or loss. That is fifteen columns. Each row takes about 90 seconds to fill in after a race result is confirmed.
Beyond the minimum, I add three optional fields that have proved their value over time. First sectional time, when available, because it allows me to track whether my early-pace assessments are accurate. Running style (railer, wide runner, middle tracker) to evaluate whether certain running styles systematically over- or underperform at my target tracks. And a brief notes field for recording anything unusual — “slow away,” “crowded first bend,” “eased down” — that the numbers alone do not capture. The overround on a six-dog race runs at roughly 125%, so any edge I find needs to be documented precisely enough to be reproduced.
What I do not record is anything subjective at the time of betting. No confidence ratings, no “feel” assessments, no post-hoc rationalisations about why a bet lost. The record captures facts. Interpretation comes later, during the monthly review, when the emotional charge of individual bets has faded and the data can be examined dispassionately.
Calculating ROI and Level Stakes Profit From Your Records
Mark Bird, the former GBGB chief executive, spoke of entering a second centenary of greyhound racing with cautious optimism. For the individual bettor, the equivalent of cautious optimism is a positive ROI confirmed by honest records. Here is how to calculate it.
Level-stakes profit (LSP) is the simplest and most honest measure. Sum the profit or loss from every bet, assuming each bet was placed at the same unit stake. If you bet 10 pounds on every race, LSP is the total amount won minus the total amount staked. Positive LSP means your selections are beating the market; negative LSP means they are not.
Return on investment (ROI) expresses LSP as a percentage of total stakes. If you staked 5,000 pounds over a period and your LSP is +350 pounds, your ROI is +7%. That figure is your edge, expressed as a single number. In greyhound betting, a sustained ROI of 3-8% is considered strong. Above 10% is exceptional and should prompt scrutiny of sample size — it may reflect luck rather than edge if the sample is below 300 bets.
Breaking ROI down by sub-category is where the real insights emerge. ROI by track tells you where your analysis is sharpest. ROI by grade tells you whether you perform better in competitive or weaker fields. ROI by bet type tells you whether your each-way bets are adding value or diluting it. ROI by odds range tells you whether you are finding value at short prices, medium prices or longshots. Each sub-category might tell a different story, and together they paint a detailed picture of where your approach succeeds and where it struggles.
One calculation that most bettors overlook is ROI adjusted for the best available price. If you record the odds you actually took and compare them against the best odds available at the time (from a price comparison tool), the difference tells you how much value you are leaving on the table by not shopping for odds. In my own records, this differential ran at 2.1% during the period before I started using multiple bookmaker accounts. That 2.1% was the difference between a marginal loss and a marginal profit.
Monthly Reviews: Identifying Patterns and Adjusting Your Approach
Data collection without review is just admin. The value of records materialises when you sit down, ideally once a month, and interrogate your data for patterns you did not notice in real time.
My monthly review follows a consistent structure. First, I calculate overall LSP and ROI for the month and compare them to the rolling three-month and twelve-month figures. A losing month within a profitable quarter is normal variance. Three consecutive losing months within a previously profitable twelve-month run is a signal that something has changed and needs investigation.
Explore greyhound racing data and API betting tools.
Second, I look at strike rate by track. If my strike rate at one venue has dropped from 22% to 14% over two months, I investigate whether the track has changed its grading, whether the surface has been modified, or whether a key trainer whose dogs I was backing has moved their operation. Mobile betting covers over 70% of wagers, so conditions can change at any venue without you physically noticing.
Third, I examine staking discipline. Did I deviate from my flat or percentage staking plan during the month? Were there any bets where I increased the stake based on emotion rather than system? Even one or two oversized bets during a losing run can distort the monthly result and mask the underlying performance of the selection method.
Fourth, I review my notes field for recurring themes. If “slow away” appears in the notes for a high proportion of my losing bets, it suggests I am overweighting dogs whose form depends on a fast break that they do not always deliver. If “crowded first bend” recurs, it might mean I am not adequately factoring trap draw and running style into my selections.
The monthly review takes about an hour. It is the single most productive hour in my bankroll management routine, because it converts raw data into actionable adjustments. Without it, the records are a diary. With it, they are a diagnostic tool that keeps my approach calibrated against the reality of results rather than the optimism of memory.