Greyhound Form Analysis: How to Read Race Cards and Spot Winners
Best Greyhound Betting Sites – Bet on Greyhounds in 2026
What Greyhound Form Analysis Tells You That Odds Alone Cannot
Three years ago, I backed a 5/2 shot at Romford purely because a mate told me “this one flies.” It lost by four lengths. The dog had been out of form for six runs, had moved up a grade, and was drawn wide on a track that punishes wide runners. I could have seen all of that in ninety seconds if I had looked at the race card. I didn’t. That evening cost me the price of a decent dinner, but it taught me a lesson worth far more — odds tell you what the market thinks, but form tells you what actually happened on the track.
Greyhound betting markets are not perfectly efficient. Favourites win roughly 30-35% of graded races across GBGB-licensed tracks, which means the market’s top pick fails two times out of three. That gap between market opinion and race outcome is where form analysis earns its keep. When you study a dog’s recent runs, sectional times, grade movements, and running style, you build your own probability estimate. Compare that estimate to the available odds, and you have the foundation of every profitable bet I have ever placed.
This guide walks through every dimension of greyhound form analysis as I practise it — from reading the raw columns on a race card to combining multiple data points into a single pre-race assessment. The method is not complicated, but it is thorough. And thoroughness, in a sport where races last thirty seconds, is the only real edge a punter has.
See also: how to win greyhound betting — your greyhound betting reference.
Decoding Every Column on a Greyhound Race Card
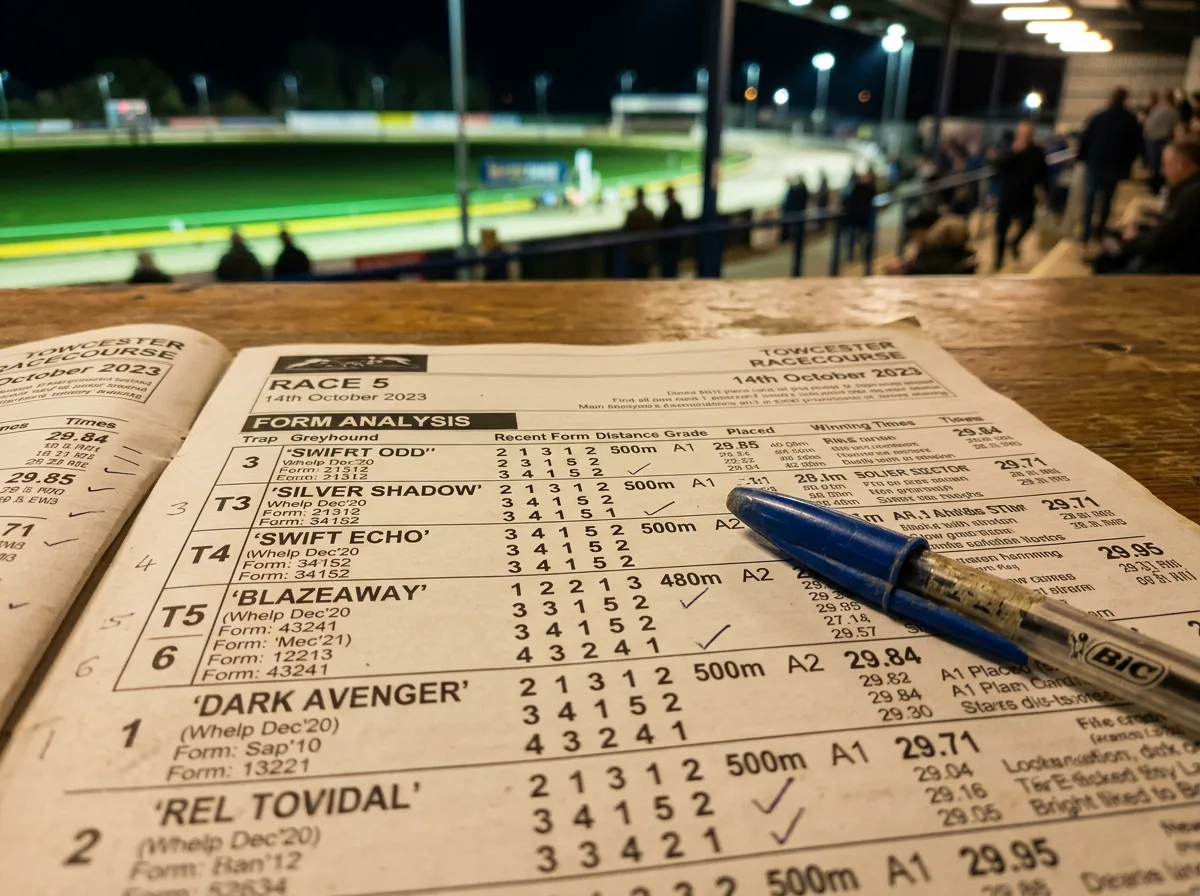
The first time I opened a greyhound race card, it looked like a spreadsheet designed by someone who hated readability. Numbers crammed into narrow columns, abbreviations I had never seen, and a form line that read like a phone number. It took me a full evening meeting at Crayford to work out what each column meant. Let me save you that evening.
Every race card — whether printed at a track or displayed on a results site — contains the same core information. The trap number appears first, colour-coded from 1 (red) to 6 (black and white stripes). Next to it sits the dog’s name, followed by the trainer’s name. These are your identifiers, and the trainer matters more than most beginners realise, but I will get to that later.
The form figures come next. You will see a string of digits — something like 3 1 2 5 4 1. Each digit represents the finishing position in the dog’s most recent races, read left to right from oldest to newest. A “1” means a win. An “m” or “M” means the dog was involved in significant trouble during the run. Some cards show a “0” for a finish outside of sixth place, and a dash for a trial run rather than a competitive race.
After the form string, you will find the dog’s best recent time at the track and distance. This number is expressed in seconds and hundredths, and it needs context — a 29.50 over 480 metres at Romford is a very different performance from a 29.50 over 480 metres at Sheffield, because track configurations, surfaces, and running distances vary. I compare times within the same venue and distance, never across tracks.
Weight is listed in kilograms, usually to one decimal place. Weight changes between runs can signal fitness shifts — a dog dropping half a kilogram or more from its previous run might be peaking, or it might be struggling. Consistency in weight is generally a positive sign. You will also see the dog’s age, sire and dam (parents), and colour. Of these, age matters most; greyhounds typically peak between two and four years old, though plenty of exceptions exist.
The grade column tells you the class of race the dog has been competing in. UK greyhound racing uses a letter-and-number system — A1 is the highest open grade at most tracks, with subsequent grades (A2, A3, and so on) representing progressively weaker fields. A dog dropping from A3 to A5 is falling through the ranks; a dog climbing from A7 to A5 is improving or being tested at a higher level. Grade context shapes everything else on the card.
Finally, most cards include sectional time data or at least the time to the first bend, the dog’s starting price from its last run, and a brief comment from the race caller describing how the dog ran. These caller comments — “led early, faded,” “slow away, finished well,” “crowded first bend” — compress an entire race narrative into a few words, and they are more useful than many bettors appreciate.
Reading Recent Form: Runs, Positions, and Finishing Times
I once watched a dog with a form line of 6 6 5 4 3 2 start at 7/1. The market was sleeping on a runner that had improved its finishing position in every single outing. It won by two lengths. That sequence — a steady upward trajectory in finishing positions — is one of the clearest signals recent form can give you, and it is available to anyone who reads the card for more than five seconds.
Recent form analysis starts with the last six runs. I look for patterns, not isolated results. A dog that finished 1 1 1 6 6 6 is not a consistent performer — it peaked and collapsed. A dog that finished 4 3 2 2 1 1 is building momentum. The sequence matters as much as the individual positions. I pay closest attention to the most recent three runs, because greyhound form can shift quickly with changes in fitness, confidence, or racing conditions.
Finishing times add a critical layer. A dog that finished third in 29.80 at Hove might have run a stronger race than a dog that won in 30.10 at the same track and distance. Position alone does not capture the quality of the performance. I record both the finishing time and the winning time of each race, because the gap between them tells me how close the dog was to the leader at the line. A dog consistently finishing within two or three lengths of the winner, even from poor positions, is running well enough to win if it gets a cleaner run.
Trouble in running is the hidden variable that separates sharp form readers from casual ones. That “m” in the form line, or a caller comment mentioning “baulked,” “checked,” or “crowded,” means the dog’s finishing position was compromised by interference. A dog that finished fifth after being knocked sideways at the first bend did not run a fifth-place race — it ran an unknown race, and you need to treat it as such. I mentally upgrade dogs that encountered trouble and mentally downgrade dogs whose recent wins came in trouble-free, unchallenged runs against weak fields.
One more detail I track: the trap drawn in each previous run. A dog with a form line of 2 3 1 might look solid, but if all three of those runs came from trap 1 on a track with strong inside bias, and tonight the same dog is drawn in trap 6, those form figures become less predictive. Form is not just what the dog did — it is what the dog did in what circumstances.
Sectional Times and Early Pace: The Data Most Bettors Ignore
Most greyhound races are decided before the dogs reach the second bend. That is not an opinion — it is a structural fact about how the sport works. The run from the traps to the first turn is where positions are established, and once a dog hits the rail in front, it has a clear run home while everything behind it fights for space. Sectional times — the split data measuring how fast a dog reaches the first timing point — capture this critical phase in a way that overall finishing times cannot.
A sectional time, sometimes called a “split” or “run-up time,” measures the interval from the traps opening to the dog reaching a fixed point on the track, typically the first bend or a sensor positioned at a set distance. At most UK tracks, this first sectional covers somewhere between 100 and 160 metres, depending on the track layout and the race distance. The number is usually displayed in seconds — a fast sectional at a 480-metre track might be around 3.80 to 4.00 seconds, while a slower one might come in above 4.30.
Why does this matter for betting? Because overall finishing times blend early speed with middle-race pace and late stamina, making it hard to isolate the one phase that determines the most outcomes. A dog with a moderate finishing time but a blazing first sectional is a front-runner that leads early and gets caught late — still dangerous in races where it draws inside and faces slow beginners. A dog with a slower sectional but a fast overall time is a closer, a dog that makes up ground in the second half of the race. Both profiles win races, but they win different types of races, and understanding sectional data in full helps you predict which profile suits tonight’s draw and field.
I compare sectional times within the same track and distance exclusively. A 4.00-second split at Monmore does not equal a 4.00 at Towcester because the run-up distances differ, the trap mechanisms vary, and the bend geometries create different demands. Within a single track-distance combination, though, sectional times are remarkably consistent for individual dogs — a fast beginner tends to break fast every time, and a slow beginner rarely surprises. That consistency makes sectionals one of the most reliable predictive metrics available.
The practical takeaway is straightforward. When two dogs in the same race have similar overall times, the one with the faster first sectional has the advantage in most scenarios, because it will reach the first bend ahead and secure the better racing line. Track geometry — which I will discuss more in the trap bias section — amplifies this advantage. Trap 1 runners with fast sectionals are a particularly potent combination on tight tracks, because they reach the rail first and force everything else to go around them. Around 18-19% of all races are won by the trap 1 runner, above the theoretical 16.6% in a six-dog field, and fast early pace is a major reason why.
Grade Drops and Rises: What Class Changes Reveal
A trainer I know at a Midlands track once told me he deliberately runs dogs in a grade above their level for two or three races before dropping them back down. The dog loses, its form figures look poor, the market dismisses it, and then it drops a grade and wins at a generous price. I am not suggesting this is common practice, but it illustrates why grade movement is one of the most underappreciated signals in greyhound form.
The UK grading system assigns dogs to race classes based on their recent performances. Win a race and you move up; lose several and you drop down. The system is designed to keep fields competitive, but it also creates predictable betting opportunities. A dog dropping from A3 to A5 is not necessarily declining — it may have been tested at a level slightly beyond it and is now returning to its natural class. That is a very different profile from a dog dropping because of injury, age, or genuine loss of ability.
To distinguish between the two, I look at the reasons behind the drop. Has the dog been running consistently fast times despite finishing out of the places? That suggests it was competitive but simply facing better opposition. Has its weight been stable? That points to physical fitness being maintained. Has it had a break between races? A short spell followed by a grade drop can mean the trainer is freshening the dog up for an easier assignment — a deliberate move, not a sign of weakness.
Grade rises deserve the opposite scrutiny. A dog climbing from A7 to A5 after two wins might look impressive, but if those wins came against weak fields with slow overall times, the promotion may expose the dog against sharper competition. GBGB tracks run approximately 25,000 BAGS races per year plus open and evening fixtures, and the sheer volume means grading adjustments happen frequently. Not every grade change carries the same weight — recent timing data and the quality of the fields the dog has been racing against tell you far more than the grade letter alone.
The sweet spot for value is a dog dropping one or two grades after racing competitively at the higher level. If the finishing times at the higher grade are faster than the typical winning times at the lower grade, you have a runner that is likely to outclass tonight’s field. The market often underestimates this, because casual bettors see the recent losing form and move on without checking the context.
Trainer and Kennel Form: A Hidden Edge in the Data
Have you ever noticed that the same three or four trainer names keep appearing in the winner’s column at your local track? That is not coincidence. Trainer form is one of the most overlooked edges in greyhound betting, partly because the data is harder to compile than individual dog form, and partly because many bettors do not think of greyhound training as a differentiating factor. It is.
A trainer’s influence on a greyhound’s performance is substantial. They control the dog’s diet, exercise regime, trial schedule, race frequency, and recovery periods. A trainer who understands a particular track — who knows which kennels produce dogs suited to the bends, which distances suit their runners, and when a dog needs a rest — will consistently outperform one who enters dogs mechanically. Mark Bird, GBGB’s former chief executive, noted the industry’s progress in areas like welfare and professional development, with participants completing over 580 hours of continuing professional development in 2024 alone. That investment in expertise filters directly into race-day results.
I track trainer win rates at specific venues rather than overall statistics. A trainer with a 15% strike rate across all tracks might have a 25% rate at one particular venue and 8% at another. When that trainer enters a dog at the high-strike-rate track, the historical edge compounds with the individual dog’s form. It is a second data layer that most bettors never bother to build.
Kennel moves matter too. When a dog transfers from one trainer to another, its form often resets. Sometimes the move signals the previous trainer giving up on the dog; sometimes it signals a fresh approach that unlocks ability. I watch for first or second runs under a new trainer — if the dog shows improvement, the new training environment is working, and the market may not have priced that in yet. Conversely, a dog that continues to underperform after a kennel change is probably declining for reasons no trainer can fix.
The practical application is simple: before I assess individual dog form in any race, I check which trainers have runners entered. If a trainer with a strong recent record at this track has a dog in the field, that dog starts with a small mental upgrade in my assessment, adjusted up or down based on its individual data.
Running Styles — Railers, Wide Runners and Middle Trackers
Picture two dogs drawn in trap 3. One hugs the inside rail from the traps, cutting across to take the shortest path around every bend. The other breaks wide, swings out on the turns, and covers extra ground on every circuit. Both dogs might have identical finishing times, but their races are completely different — and so is their value depending on tonight’s draw, the dogs around them, and the track geometry.
Running style in greyhound racing falls into three broad categories. Railers run tight to the inside rail, saving ground on bends but vulnerable to crowding if another dog gets to the rail first. Wide runners swing out, covering more distance but avoiding the traffic that often develops on the inside. Middle trackers split the difference, running a line between the rail and the outside, adapting their position based on the pace of the race. Each style has advantages and disadvantages that change depending on the trap draw.
A railer drawn in trap 1 is in its ideal position — shortest path to the first bend, natural line to the rail, minimal interference from other runners. The same railer drawn in trap 5 or 6 faces a problem: it needs to cut across four or five dogs to reach the rail, which often means losing ground or getting bumped at the first bend. Caller comments from previous races are the quickest way to identify running style — phrases like “railed throughout,” “went wide on bends,” or “ran middle” tell you exactly how the dog moves.
Wide runners present an interesting puzzle for bettors. They are penalised by the extra distance they cover, but they avoid the bunching and interference that costs railers their position in crowded fields. On tracks with long straights and sweeping bends, the penalty for running wide is smaller, and a wide runner with strong late pace can swoop past tiring railers in the home straight. On tight, sharp tracks, the extra ground is nearly impossible to make up, and wide runners rarely win unless they have exceptional raw speed.
I factor running style into every selection by cross-referencing it with the trap draw and the styles of the other runners in the field. A race where three railers are drawn in traps 1, 2, and 3 is likely to produce crowding on the inside at the first bend — which creates space for a wide runner drawn outside to avoid trouble and capitalise. A race with only one railer in trap 1 and five wide or middle runners is a recipe for a clean inside run. Reading the field’s collective running styles is just as important as reading any individual dog’s form.
Putting It Together: A Practical Form Assessment Workflow
Every method is useless if it takes you forty-five minutes per race. Greyhound meetings run fast — a new race every fifteen minutes at most tracks — and if your form analysis cannot keep pace, you will either rush your assessments or miss races entirely. Over the past eight years, I have compressed my approach into a workflow that takes roughly five minutes per race. Here is how it works.
Step one: scan the grade column. I want to know immediately whether any dog in the field has dropped in class. A grade drop with competitive recent times is my first filter for potential value, and I mark those dogs before looking at anything else.
Explore trap bias statistics in greyhound racing.
Step two: check the trainer names. If a trainer with a strong venue record has a runner, that dog gets a mental flag. This takes about ten seconds once you have built familiarity with the regular trainers at your chosen tracks.
Step three: read the form lines for all six dogs. I am looking for trends — improving sequences, consistent finishes in the top three, or recent trouble in running that might have masked ability. Dogs with deteriorating form (positions getting worse over recent runs) get deprioritised unless the grade drop from step one explains the poor results.
Step four: compare finishing times. I look at each dog’s best recent time at tonight’s track and distance, focusing on the last three runs. If one or two dogs have clearly faster times than the rest of the field, they become my core selections. If the times are tightly clustered, the race is competitive and I rely more heavily on other factors to separate the runners.
Step five: check sectional times and running styles against the trap draw. A fast-breaking railer in trap 1 gets upgraded. A slow beginner drawn wide gets downgraded. I overlay the running styles of the full field to anticipate where crowding might occur at the first bend and which dogs might benefit from a clean run.
Step six: arrive at a probability estimate. I am not calculating to two decimal places — I am deciding whether a dog has a roughly one-in-three chance, a one-in-four chance, or a one-in-six chance. If my estimate gives a dog a better chance than the odds imply, that is a potential bet. If the odds are shorter than my estimate warrants, I move on. Favourites win about 30-35% of graded races, but they lose roughly two-thirds of the time. The value lies in the races where the market has underestimated a contender or overestimated the favourite. In open races the dynamic shifts — favourites at some venues win over half their starts, which means the market is more efficient and value is harder to find.
This workflow is not magic. It is a structured approach to reading information that is freely available on every race card. The edge comes from doing it consistently and honestly — recording your assessments, tracking your results over time, and adjusting when the data shows your judgements are off. As with any data-driven betting strategy, the discipline to follow the process matters more than any single insight.