Greyhound Value Betting: How to Find Odds the Bookmakers Got Wrong
Best Greyhound Betting Sites – Bet on Greyhounds in 2026
Value Betting Is the Only Long-Term Edge in Greyhound Markets
Early in my betting career, I had a month where I picked more winners than I ever had before. My strike rate was close to 30%, I was selecting dogs that crossed the line first with gratifying regularity, and I felt like I had cracked it. Then I checked my profit-and-loss sheet and discovered I had lost money. Not a catastrophic amount, but a clear, undeniable loss. The winners were coming at short odds — 6/4, evens, 4/5 — and the losers, though fewer in number, had wiped out the gains. I was picking winners. I was not finding value.
That distinction is the single most important concept in greyhound betting. Value exists when the odds offered on a dog are higher than the dog’s actual probability of winning. If a greyhound has a genuine 25% chance of winning, it needs to be priced at 3/1 or better before the bet has a positive expected return. At 2/1, the same dog with the same chance is a losing proposition over time. The overround built into a typical greyhound race — approximately 125%, giving the bookmaker a built-in margin of roughly 25% — means that most bets are priced below their true probability. Finding the ones that are not is the only sustainable path to profit.
This article lays out the mechanics of value betting in greyhound markets: how to calculate expected value, how to identify mispriced runners using price comparison tools, and how to distinguish genuine value from the illusion of generous odds on a dog that deserves to be a long shot.
See also: how to win greyhound betting — expert greyhound betting strategies.
Expected Value Explained: The Formula Behind Every Profitable Bet
Expected value is not a complicated idea. It is the answer to a simple question: if I placed this exact bet a thousand times, would I end up with more money or less money than I started with? Positive expected value means more. Negative expected value means less. Every single bet you place has an expected value, whether you calculate it or not.
The formula is straightforward. Take the probability you assign to the dog winning, multiply it by the profit you would receive if it wins, then subtract the probability of it losing multiplied by the stake you would lose. In mathematical terms: EV = (probability of winning x net profit) – (probability of losing x stake). If the result is positive, you have a value bet. If it is negative, you are paying more than the bet is worth.
Let me run through a concrete example. Suppose I assess a dog at a 25% chance of winning after studying its form, trap draw, sectional times, and the rest of the field. The bookmaker is offering 4/1. If I stake 10 pounds, my net profit on a win is 40 pounds. The EV calculation: (0.25 x 40) – (0.75 x 10) = 10 – 7.50 = +2.50. Over many repetitions, this bet returns 2.50 pounds of profit per 10-pound stake. That is a value bet.
Now change the odds to 2/1. Same dog, same 25% probability. The calculation becomes: (0.25 x 20) – (0.75 x 10) = 5 – 7.50 = -2.50. Negative expected value. Even though the dog still wins one in four times, the payout is not large enough to compensate for the three times it loses. This is the bet that felt good during my losing month — I was picking winners at odds that did not justify the risk.
The hard part, obviously, is assigning the probability. Bookmakers do not tell you the true odds; they tell you what they are willing to pay, adjusted by the overround to guarantee their margin. Your job as a value bettor is to build your own probability estimate — using form, trap data, sectional times, grade context, and every other input covered in this guide — and then compare it to the price on offer. The accuracy of your probability estimates determines whether you find genuine value or merely think you have.
I do not calculate EV to two decimal places before every bet. What I do is build a rough probability estimate for each dog in a race — does this runner have a 15% chance, a 25% chance, a 35% chance? — and then ask whether the odds on offer exceed what that probability warrants. If I think a dog has a 20% chance and it is priced at 7/1, the implied probability of the odds (12.5%) is well below my estimate. That is a bet worth taking. If the same dog is at 3/1 (implied 25%), it is roughly fair. At 2/1 (implied 33%), I am being asked to pay more than the dog is worth. The process is simple. The discipline to walk away from the 2/1 shot is not.
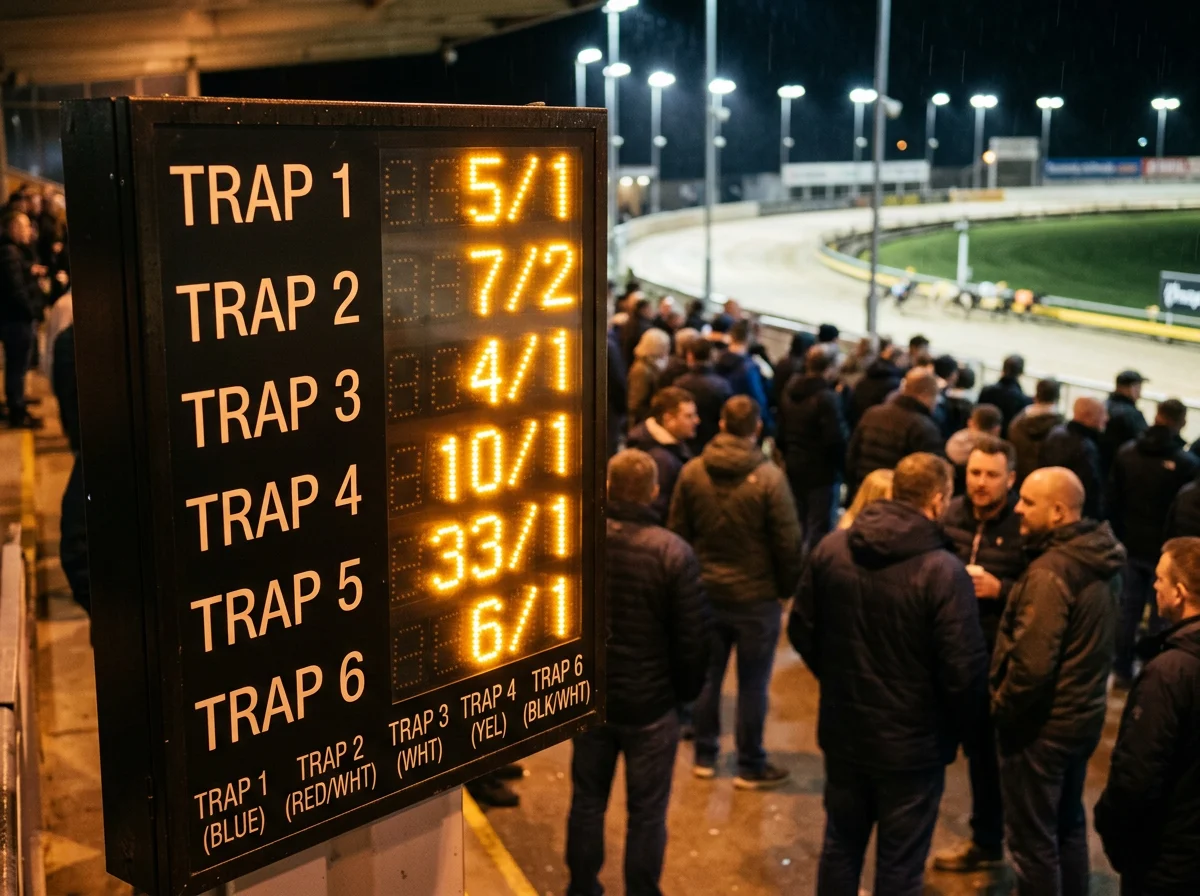
Tissue Prices and Market Outliers: Reading Oddschecker for Value
Before odds go live on a race, bookmakers’ traders compile what the industry calls tissue prices — their initial estimate of what each dog’s odds should be, based on form, draw, and grade. These tissue prices are not published directly, but you can see their fingerprint in the early-morning markets. When the first prices appear on a comparison tool, they cluster around the traders’ assessment. And that is where the fun begins, because not every bookmaker agrees.
Open a price comparison page for any greyhound race about an hour before the off, and you will often see five or six bookmakers offering similar odds on the favourite — say, 5/2 across the board. But look at the runners priced at 4/1 and above, and the spread widens. One bookmaker might have a dog at 5/1 while another has it at 8/1. That discrepancy is a signal. It means the bookmakers’ traders have assessed the same dog’s chances differently, and at least one of them may have got it wrong.
The outlier — the bookmaker offering significantly higher odds than the rest of the market — is where value bettors focus. If five bookmakers price a dog at 5/1 and one has it at 9/1, you need to ask why. Sometimes the outlier has not yet adjusted its prices to account for a late change (a different trap, a reserve runner coming in). Sometimes its trader simply disagrees with the market consensus. And sometimes the outlier is right and the rest of the market is wrong — but in the meantime, 9/1 on a dog that the consensus says should be 5/1 is a value bet if your own analysis supports a probability closer to the 5/1 assessment.
I use price comparison as a screening tool, not a decision tool. It tells me where to look, not what to bet. If I see a large outlier on a dog I already rated highly in my form analysis, the case for a bet becomes stronger. If I see an outlier on a dog I rated poorly, I assume the rest of the market is correct and the outlier is simply slow to update. The key is combining market data with independent analysis — not outsourcing your thinking to the price board.
One more technique worth learning: watching how prices move between the early market and the off. If the consensus 5/1 shot drifts to 7/1 in the final twenty minutes, it usually means money has come for other dogs in the race. If the same dog shortens to 3/1, someone with access to information — recent trials, paddock observations, connections’ confidence — is backing it. Price movement before the off is a data stream that casual bettors barely glance at and serious bettors monitor obsessively.
Smart Money Signals: When Odds Move Before a Race
There is a moment, usually five to ten minutes before a race, when something shifts in the market. A dog that was 6/1 suddenly drops to 7/2. No public information has changed — same form, same draw, same card. But someone, somewhere, has placed enough money to move the odds, and the bookmakers have responded by shortening the price. That is smart money, and whether you follow it, fade it, or ignore it says a lot about your betting approach.
Smart money in greyhound markets typically comes from connections — trainers, kennel hands, people who have watched the dog in trials or observed its condition in the paddock. Greyhound racing, unlike horse racing, does not have a deep layer of professional punters analysing every race with sophisticated models. The information asymmetry runs between people who have seen the dog train and people who are reading the card. When connections back their own dog, the odds move, and that movement is visible to anyone watching the price boards.
I treat significant late shortenings as an additional data point, not a trigger. If a dog I have already rated positively in my own analysis gets backed from 5/1 to 5/2 in the final minutes, that reinforces my selection and I increase my confidence. If a dog I rated poorly gets the same treatment, I re-examine my analysis but do not automatically follow the money — connections can be wrong, especially about dogs they are emotionally invested in. Richard Wayman of the British Horseracing Authority observed that shifts in customer behaviour around affordability checks have changed the profile of large-staking customers, and similar dynamics play out in greyhound markets. Fewer big punters mean that individual large bets move the market more than they used to, which can create false signals.
Drifts — odds lengthening before the off — are equally informative. A dog drifting from 3/1 to 5/1 suggests that either money is coming for other runners or that informed opinion has turned against it. Drifts are particularly meaningful in smaller greyhound markets, where liquidity is thin and a single bookmaker adjusting prices can ripple across the board. I view a drift on a dog I was considering as a warning flag, not a buying opportunity. The market is telling me something, and I listen.
Why Backing Favourites Rarely Offers Value — and When It Does
Favourites win around 30-35% of graded greyhound races. At certain venues, particularly in open races, that figure climbs higher — some tracks see favourites winning over half their open-race starts. Those numbers look attractive. They are not. The problem is that the odds on favourites are almost always too short to generate a positive return at those strike rates.
Consider a favourite winning 33% of the time. For flat staking at level stakes to break even, the average odds need to be 2/1 — a return that gives you your stake back plus double it. In practice, greyhound favourites are typically priced between 6/4 and 2/1, with many at evens or shorter. At evens and a 33% strike rate, you win 33 bets and lose 67 out of every 100. Your profit on winners: 33 units. Your loss on losers: 67 units. Net loss: 34 units. You picked the most likely winner in every race, and you still lost a third of your bankroll.
The market is relatively efficient at pricing favourites because they attract the most attention and the most money. Bookmakers know that recreational bettors gravitate toward short-priced runners, and they price accordingly. The overround is often loaded most heavily onto the favourite, meaning the favourite’s odds are shortened more than any other runner’s to protect the bookmaker’s margin. That is why blind favourite-backing strategies show consistent long-term losses in every study I have seen.
That said, favourites do offer value in specific circumstances. In open races with small, high-quality fields, the favourite is sometimes a genuinely dominant runner that the grading system has placed against inferior opposition. If my form analysis gives that dog a 45% chance of winning and the odds are 6/4 (implied probability 40%), the bet has positive expected value. The key is that my assessment must exceed the implied probability of the price, not merely confirm that the dog is the most likely winner. Being the best dog in the race is not enough — it has to be better than the market thinks it is.
Second favourites win 16-18% of races, and outsiders ranked fifth or sixth in the market win 5-6%. These lower-ranked runners are often where the greatest mispricing occurs, because they attract less market attention and less betting volume. A dog ranked fourth in the market at 8/1 but assessed by my own analysis at a 15% chance (fair odds roughly 11/2) is a value bet — and it is a bet that most recreational punters will never place because they cannot stomach the frequency of losses. Seventeen or eighteen losses for every three or four winners is hard on the nerves. But the maths works if your probability estimates are accurate.
Betting Exchanges vs Bookmakers: Where Value Sits
I placed my first bet on a greyhound exchange market in 2019 and was immediately struck by two things: the odds were better than any bookmaker was offering, and the liquidity was terrible. Both remain true in 2026, and understanding that trade-off is essential for any value bettor deciding where to place their money.
Betting exchanges work by matching backers (people betting on a dog to win) with layers (people betting against it). Because there is no bookmaker setting the odds, there is no built-in overround. The exchange takes a commission on winning bets — typically 2-5% — but the resulting odds are often 10-20% better than the best bookmaker price. On a dog priced at 4/1 with a bookmaker, the exchange might offer 9/2 or 5/1. That difference, compounded over hundreds of bets, is substantial.
The problem is liquidity. UK greyhound betting turnover reached 1.5 billion pounds in 2022-23, but the vast majority of that flows through traditional bookmakers. Off-course betting alone accounted for nearly 740 million pounds in one financial year. Exchange markets for greyhounds are thin by comparison. On a midweek BAGS meeting, you might struggle to get more than 20 or 30 pounds matched on a single runner before the off. At major fixtures — Saturday open races, Derby heats — liquidity improves, but it never approaches the depth of exchange markets for horse racing or football.
For small-stakes bettors, exchanges are an obvious choice when liquidity allows. The better odds translate directly into better long-term returns. For larger-stakes bettors, the practical ceiling on matched amounts means exchanges often cannot absorb the volume, and bookmakers remain the primary route. My approach is to check the exchange price first and attempt to get matched there. If the market is too thin, I fall back to the best bookmaker price. The extra minute it takes to check both is a minute that regularly earns me an extra point or two of odds on the runners I have selected.
Recording and Reviewing Your Value Bets
Value betting without record-keeping is guesswork wearing a suit. You cannot know whether your probability estimates are accurate unless you track them against outcomes over a meaningful sample. I record every bet I place in a spreadsheet with the following columns: date, track, race time, dog name, trap, my assessed probability, the odds I took, the stake, and the result. At the end of each month, I review.
Understand greyhound betting odds explained.
The review asks two questions. First, is my overall return positive at level stakes? If I am backing value bets consistently and my probability estimates are roughly accurate, I should be showing a profit over any 200-bet sample. Short-term variance can mask the answer over 30 or 50 bets, but beyond 200, the signal starts to emerge from the noise.
Second, are my estimates calibrated? If I have been assessing dogs at a 25% probability, roughly one in four should be winning. If only one in six is winning, I am overestimating their chances and need to adjust. If one in three is winning, I am underestimating and potentially leaving value on the table by not betting more aggressively. Calibration review is the mechanism that turns value betting from a theory into a tested, self-correcting method.
I am honest about my results, and I recommend you are too. The temptation to exclude losing bets, reclassify borderline selections as “not real bets,” or blame external factors is universal. Resist it. The spreadsheet does not care about your excuses. It cares about whether you are making money, and if you are not, it tells you where to look. That discipline — recording, reviewing, adjusting — is what separates bettors who improve from bettors who repeat the same mistakes for years. For a deeper look at the maths and mechanics, the odds explained guide covers overround calculation and implied probability in detail.