Greyhound Sectional Times Explained: What Split Data Reveals About Race Pace
Best Greyhound Betting Sites – Bet on Greyhounds in 2026
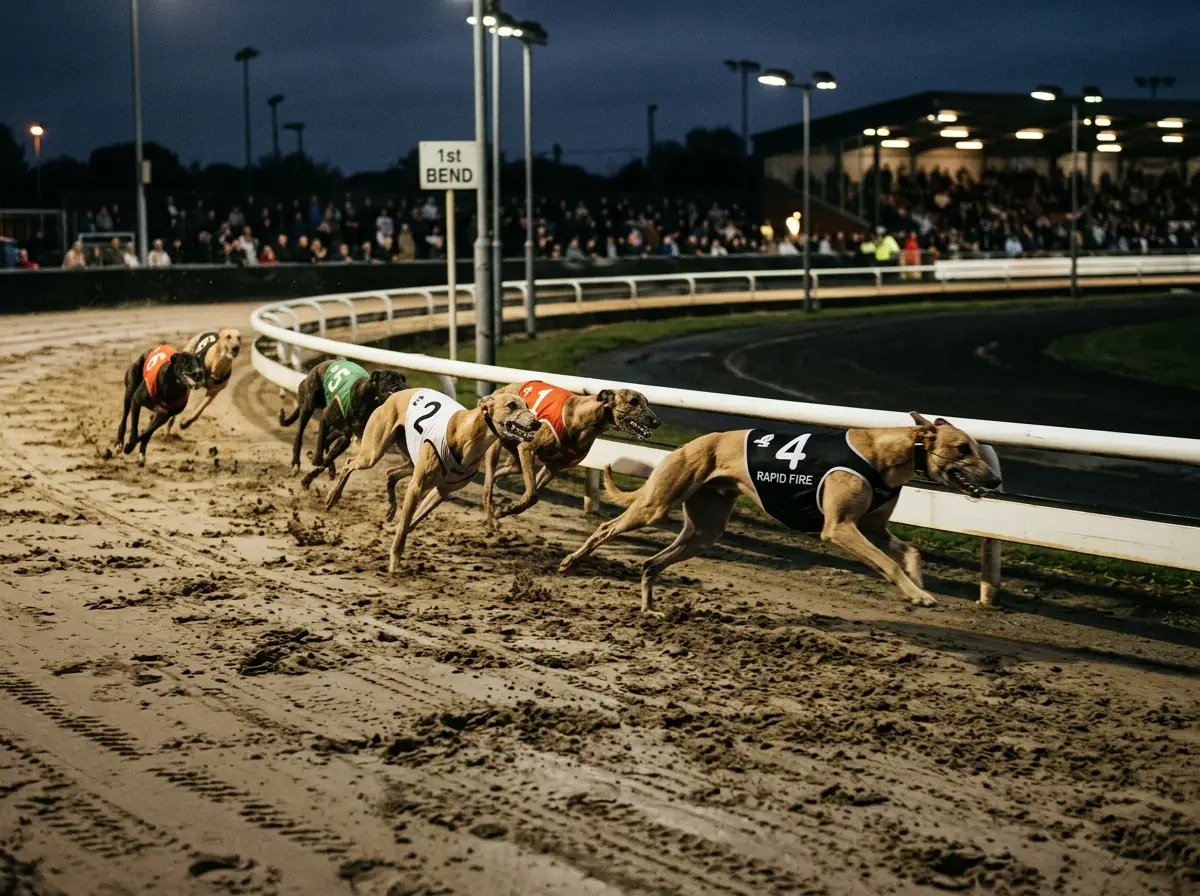
Why the First Bend Decides Most Greyhound Races
Watch enough greyhound racing and you will notice the same pattern repeating: the dog that leads into the first bend wins more often than any other metric would predict. Trap 1 carries a win rate of roughly 18-19% against the theoretical 16.6% for a six-runner field, and the primary reason is geometry — the inside dog has the shortest path to the first turn. But beyond trap draw, the factor that determines which dog reaches that bend first is early pace, and the only way to measure early pace objectively is through sectional times.
Sectional times record how long a greyhound takes to reach specific points on the track — typically the first bend, the back straight, and the finish. In a standard 480-metre race, the sectional to the first bend covers roughly the first 100-120 metres. That is where races are won and lost. A dog that reaches the first bend in front avoids the crowding, checking and interference that slows mid-pack runners. It runs its own race from the front, on the rail, covering the minimum distance.
Finishing times alone cannot tell you this story. Two dogs might both run 29.50 seconds over 480 metres, but one reached the first bend in 5.80 seconds and controlled the race from the front, while the other ran 6.20 to the bend, got crowded, and stormed home through traffic. These are fundamentally different race profiles, and only sectional data separates them. Finishing times are summaries; sectional times are the narrative.
See also: how to win greyhound betting — all about greyhound betting.
What Sectional Times Measure and How They Differ From Finishing Times
I spent my first two years of greyhound betting looking only at finishing times, and it cost me. A dog posting 29.40 looks faster than one posting 29.70. But if the 29.40 dog was led to the bend by a dawdler and ran the entire race without interference, while the 29.70 dog was bumped at the first and second bends and still finished within three lengths, the slower dog is arguably the better prospect for a race where it draws inside and avoids traffic.
UK greyhound tracks run approximately 25,000 BAGS races annually, plus open and evening fixtures. Across that volume, the variety of pace scenarios is enormous. Sectional times allow you to normalise performance by isolating specific phases of a race. The key segments are the run-up (from traps to the first timing point), the first sectional (to the first bend), the middle sectional (back straight), and the final sectional (home straight to finish).
The first sectional — sometimes called the “split” — is the one I weight most heavily. It tells you how quickly a dog breaks from the traps and reaches racing speed. A dog with a consistently fast first split has a structural advantage because greyhound racing, unlike horse racing, offers very limited opportunities to make ground once the field has settled. There are no straight miles to run down a leader; most UK tracks are tight ovals where the inside rail is the shortest route and the front-runner controls the racing line.
Finishing times also absorb variables that have nothing to do with the dog’s ability — wind conditions, track watering schedules, temperature affecting the surface. Sectional times are subject to the same variables, but comparing sectionals within the same race eliminates most of them. If one dog ran a 5.85 first split and another ran 6.10 in the same race, the difference reflects genuine pace disparity, not track conditions.
Reading Sectional Data: Calculating and Comparing Pace
There is no magic formula for reading sectionals, but there is a practical workflow I have refined over several years that catches patterns the race card alone does not reveal.
Start with the first sectional time for each dog in its most recent three runs. Look for consistency: a dog that runs 5.80, 5.82, 5.85 to the first bend is a reliable front-runner. A dog that runs 5.80, 6.15, 5.90 is erratic — fast when it breaks well, slow when it does not. Both dogs might have the same average, but the consistent dog is a far better betting proposition because its performance is predictable.
Next, adjust for trap draw. A dog breaking from trap 6 that runs a 5.90 first split is showing stronger early pace than a dog from trap 1 running the same time, because the outside dog has further to travel to reach the first bend. When that trap-6 dog moves to an inside draw, its first sectional is likely to improve, and with it, its chance of leading at the bend. This trap-adjusted sectional analysis is one of the most under-utilised tools in greyhound betting. I have found value repeatedly by spotting dogs with fast raw sectionals from wide draws that the market underprices when they move inside.
The middle and final sectionals matter too, but they serve a different purpose. A dog with a fast first split and a slow final sectional is a confirmed front-runner that tires — it needs to lead early and hang on. A dog with a moderate first split but a fast final sectional is a closer, and its chance depends entirely on finding a clear run through the field. Matching these pace profiles to the likely race shape — who leads, who chases, who finishes fastest — is where sectional data transforms into practical selection.
Using Sectional Times to Compare Greyhounds Across Different Meetings
Comparing sectional times between different tracks is the hardest part of this analysis, and the place where most bettors make errors. A 5.80 first split at one track is not the same as a 5.80 at another. Track configurations vary — different run-up distances from trap to first bend, different bend radii, different surface types. Comparing raw sectionals across venues without adjustment produces misleading conclusions.
Explore running style analysis for greyhound betting.
The approach I use is to benchmark each dog’s sectional against the average first sectional at that track on that meeting. If the track average first split for the evening is 6.00 and a dog ran 5.82, it was 0.18 seconds faster than average — and that relative performance is comparable across venues. A dog that runs 0.15 seconds faster than track average at Nottingham is demonstrating similar early pace quality to one that runs 0.15 faster at Sunderland, even if the raw times are different.
This benchmarking also accounts for daily variations in track speed. A track that has been heavily watered runs slower overall, which inflates all sectional times. Raw comparison would penalise every dog running on that surface. Relative comparison strips out the surface variable and isolates the dog’s performance against its peers.
One word of caution: sectional data availability varies significantly across UK tracks. Some venues provide detailed split times as standard, while others offer only finishing times. When sectional data is unavailable, I fall back on trap-to-first-bend position data from race comments — “led first bend,” “crowded first bend,” “slow away” — as a qualitative substitute. It is less precise than measured splits, but it captures the same essential information: did this dog show early pace, and did it lead at the crucial point of the race?
Building a personal database of sectional comparisons across two or three tracks you follow regularly is one of the most effective edges available to a greyhound bettor. The market generally prices dogs on finishing times and recent results. Sectional analysis reveals the how behind those results, and the how is a better predictor of future performance than the what.